
WindMar v0.2.3: Weather routing on a transatlantic feeder lane
Download the illustrated study (PDF)
How much fuel does weather routing actually save on a working feeder run, and how much of that saving is the routing rather than simply the geometry of the crossing? To answer honestly, WindMar replayed a full year of real weather on one transatlantic lane and scored every passage against a plain, held-speed baseline. What follows is the whole distribution, not a single favourable voyage, and every passage with its weather is listed at the end.
The lane and the method
The corridor runs from Pointe-à-Pitre in Guadeloupe to the Ushant traffic separation scheme west of France, a North Atlantic diagonal of about 3,300 nautical miles. The vessel is a generic small feeder of roughly 1,100 TEU, laden, held at an instructed engine speed of 12.5 kn through the water.
Fifty-two weekly departures across 2024 were each replayed on the archived reanalysis field for their own week: ERA5 winds and waves, plus GLORYS ocean currents. Currents are in the fuel accounting but weak on this crossing, a few tenths of a knot and mostly a slight push, so they are a second-order factor beside wind and waves.
Every passage is scored against a two-waypoint rhumb-line baseline sailed at the same instructed speed. That is a deliberately honest reference rather than a strawman. Two operating modes are reported:
- Best ETA keeps the instructed speed and routes around the weather, arriving as early as the sea allows.
- Best ETA + JITA takes the same route but holds the baseline arrival time, spending the recovered hours as slower, cleaner steaming.
Results across the year
The figures are fuel change against the rhumb baseline, so a saving is negative and a heavier burn is positive. Best cut is the largest reduction of the year.
| Operating mode | Median | Mean | Best cut | Weeks near 0% | Schedule held |
|---|---|---|---|---|---|
| Best ETA | -2.45% | -2.55% | -6.97% | 5/52 | n/a (speed held) |
| Best ETA + JITA | -6.04% | -5.89% | -10.17% | 1/52 | -0.01 h median |
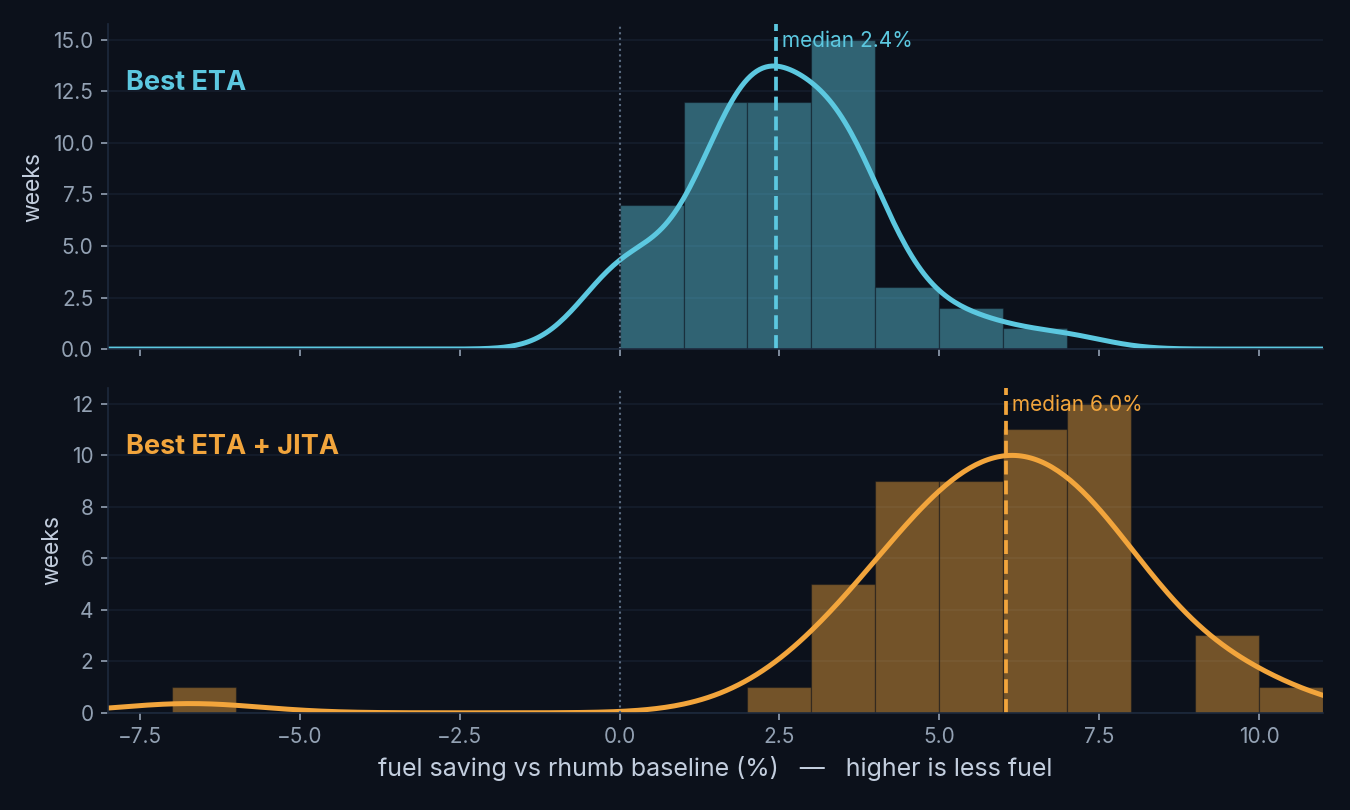
Across the 52 weekly passages the two modes separate clearly. At held speed (Best ETA) the fuel change clusters around a couple of percent of saving, with a handful of storm weeks near zero. Just-in-time arrival moves the whole distribution further into saving: 36 of 52 weeks save at least 5%, for a median of about 6.0% and roughly 8.4 MT of bunkers per crossing, while arrival is held to a median -0.01 h of schedule. Best ETA delivers a saving in 47 of the 52 weeks; one March storm week sits on the positive side, having burned more to keep its schedule.
About half of the gain is geometry
On this diagonal the great circle is about 1.3% shorter than the rhumb baseline. Roughly half of the 2.4% held-speed median is therefore geometry: the baseline gives up the shorter track, and taking it back recovers that distance directly. Weather routing brings the other half.
The same shorter track also arrives early, and just-in-time arrival converts that time into fuel. So in both modes about half of the gain traces back to geometry: directly as distance under Best ETA, and as the time it frees under Best ETA + JITA.
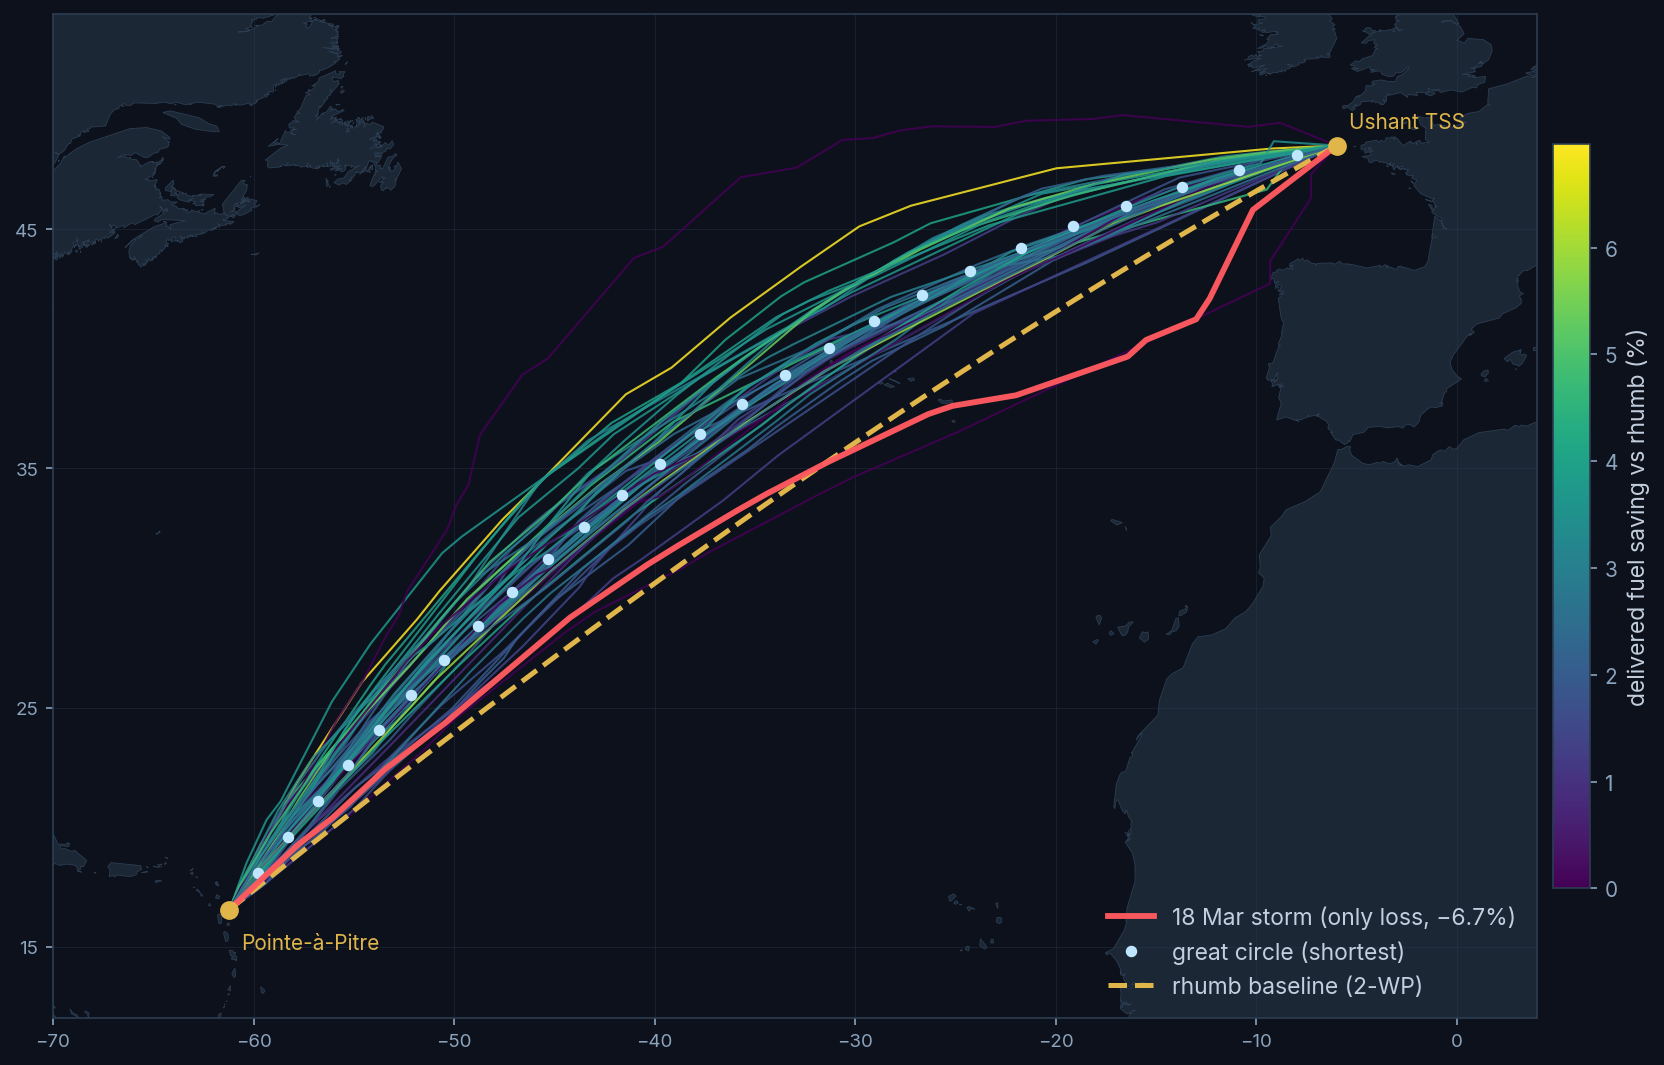
The gold dashed line is the rhumb baseline; the light dotted line is the great circle; the coloured tracks are the 52 optimised routes, coloured by delivered saving. The red track is the one week the routing cost fuel.
The week it cost fuel
On the 18 March departure the sea was severe, with significant wave height reaching 6.9 m. The rhumb baseline plowed straight through it. WindMar found a route that detoured an extra 100 nm around the storm core, and because Best ETA + JITA has to hold the arrival time, it burned about 6.7% more fuel over that longer track. This was the only week of the year that cost fuel. It is not a routing failure: Best ETA sets no arrival deadline, so the same week is neutral, the engine holding the baseline and simply arriving later. The fuel was spent buying a far steadier, safer ship through a heavy sea, a seakeeping gain the fuel figure alone does not credit.
How to read these numbers
The figures are bounded in two opposite directions, and both are stated plainly.
- They are a ceiling. This is a reanalysis replay: the optimiser saw each voyage's actual weather. A live passage is routed on a forecast that decays over the roughly 11-day crossing, so live forecast-driven routing realises less than the numbers here.
- The ship model is conservative. The feeder is generic and its weather-response coefficients are held at unity, not yet calibrated to a real vessel's noon-report history. That works the other way, understating the true sensitivity.
- The real test is a ship in service. Route on the live forecast, then check the fuel actually burned against the ship's own noon reports. That needs a vessel in service, which this modelled feeder is not.
Every passage, with its weather
The full distribution behind the medians. Wind and wave are mean and maximum along the passage. Every fuel and distance figure is a change against the rhumb baseline, so a saving is negative; the one positive week burned more to hold its arrival through a storm.
| Departure | Wind mean/max (m/s) | Hs mean/max (m) | Δ Best ETA | Δ + JITA | Δ fuel (MT) | Δ dist (nm) |
|---|---|---|---|---|---|---|
| 1 Jan | 8.91 / 15.3 | 3.43 / 6.0 | -0.2% | -3.5% | -4.9 | -32 |
| 8 Jan | 7.98 / 14.8 | 2.92 / 4.3 | -1.8% | -5.2% | -7.6 | -24 |
| 15 Jan | 9.62 / 16.2 | 3.28 / 5.4 | -1.9% | -5.9% | -8.2 | -21 |
| 22 Jan | 7.25 / 15.3 | 2.81 / 4.4 | -1.8% | -5.6% | -8.0 | -34 |
| 29 Jan | 8.97 / 15.2 | 2.45 / 4.0 | -0.9% | -3.8% | -5.0 | -37 |
| 5 Feb | 10.34 / 15.3 | 3.08 / 5.6 | -1.3% | -4.4% | -5.8 | -21 |
| 12 Feb | 9.8 / 19.0 | 4.25 / 7.5 | 0.0% | -3.6% | -5.3 | +133 |
| 19 Feb | 8.88 / 18.9 | 2.53 / 7.2 | -4.6% | -7.1% | -10.2 | -10 |
| 26 Feb | 7.59 / 16.0 | 2.78 / 4.8 | -2.1% | -4.5% | -6.5 | -22 |
| 4 Mar | 8.73 / 15.5 | 2.72 / 4.6 | -1.9% | -5.8% | -8.0 | -32 |
| 11 Mar | 6.24 / 13.3 | 2.92 / 4.2 | -2.3% | -5.6% | -7.8 | -34 |
| 18 Mar | 9.55 / 18.1 | 3.12 / 6.9 | 0.0% | +6.7% | +9.9 | +100 |
| 25 Mar | 10.6 / 16.4 | 3.29 / 5.1 | -1.2% | -4.8% | -6.7 | -26 |
| 1 Apr | 7.23 / 12.9 | 2.58 / 3.4 | -2.5% | -6.3% | -8.6 | -38 |
| 8 Apr | 7.74 / 12.7 | 2.26 / 3.3 | -7.0% | -9.4% | -14.4 | -1 |
| 15 Apr | 5.63 / 12.0 | 1.87 / 2.7 | -1.8% | -4.2% | -5.8 | -38 |
| 22 Apr | 6.53 / 10.6 | 1.72 / 3.0 | -3.7% | -7.8% | -10.9 | -9 |
| 29 Apr | 6.89 / 13.4 | 2.01 / 3.2 | -1.7% | -5.0% | -6.8 | -29 |
| 6 May | 5.51 / 10.6 | 1.76 / 2.7 | -4.0% | -7.9% | -11.1 | -14 |
| 13 May | 3.4 / 6.1 | 1.32 / 1.9 | -1.4% | -3.6% | -4.9 | -22 |
| 20 May | 5.64 / 10.6 | 1.36 / 2.2 | -3.1% | -6.3% | -8.6 | -14 |
| 27 May | 4.47 / 8.5 | 1.36 / 1.9 | -1.3% | -4.9% | -6.8 | -24 |
| 3 Jun | 6.1 / 13.0 | 1.38 / 2.7 | -2.1% | -4.7% | -6.3 | -22 |
| 10 Jun | 5.52 / 9.5 | 1.24 / 2.0 | -3.7% | -7.5% | -10.3 | -28 |
| 17 Jun | 4.98 / 8.7 | 1.49 / 2.9 | -2.5% | -5.3% | -7.2 | -34 |
| 24 Jun | 5.66 / 10.2 | 1.39 / 2.2 | -3.4% | -7.0% | -9.7 | -34 |
| 1 Jul | 6.59 / 11.4 | 1.46 / 2.8 | -1.9% | -5.6% | -7.7 | -33 |
| 8 Jul | 6.15 / 8.8 | 1.33 / 2.0 | -1.7% | -4.8% | -6.6 | -35 |
| 15 Jul | 4.96 / 9.3 | 1.17 / 1.7 | -3.3% | -7.9% | -10.8 | -35 |
| 22 Jul | 4.67 / 9.0 | 1.19 / 1.6 | -2.3% | -6.0% | -8.3 | -38 |
| 29 Jul | 5.82 / 11.1 | 1.53 / 2.1 | -2.7% | -6.9% | -9.5 | -38 |
| 5 Aug | 6.11 / 10.7 | 1.58 / 2.6 | -3.2% | -7.4% | -10.3 | -40 |
| 12 Aug | 5.44 / 13.9 | 1.7 / 3.4 | -3.6% | -7.8% | -10.7 | -34 |
| 19 Aug | 6.2 / 9.6 | 1.6 / 2.1 | -3.1% | -6.5% | -9.1 | -32 |
| 26 Aug | 5.96 / 14.0 | 1.55 / 3.2 | -3.5% | -7.3% | -10.3 | -27 |
| 2 Sep | 5.91 / 10.9 | 1.56 / 2.7 | -3.2% | -8.0% | -11.1 | -28 |
| 9 Sep | 7.29 / 12.6 | 1.77 / 3.1 | -5.3% | -10.2% | -14.2 | -27 |
| 16 Sep | 8.15 / 17.5 | 2.14 / 4.3 | -2.4% | -6.3% | -8.7 | -35 |
| 23 Sep | 6.95 / 12.1 | 2.0 / 3.2 | -3.1% | -6.6% | -8.8 | -30 |
| 30 Sep | 6.89 / 24.1 | 3.26 / 11.6 | 0.0% | -5.8% | -8.2 | +140 |
| 7 Oct | 7.61 / 17.6 | 2.8 / 4.8 | -2.5% | -5.6% | -7.8 | -18 |
| 14 Oct | 7.43 / 16.4 | 2.5 / 6.2 | -3.4% | -7.1% | -10.0 | +3 |
| 21 Oct | 6.82 / 11.0 | 1.72 / 2.4 | -4.7% | -9.3% | -13.3 | -29 |
| 28 Oct | 9.17 / 14.9 | 2.7 / 4.4 | 0.0% | -3.1% | -4.3 | -27 |
| 4 Nov | 9.31 / 16.9 | 2.65 / 4.9 | -4.0% | -7.2% | -10.5 | -37 |
| 11 Nov | 7.79 / 15.2 | 2.49 / 4.4 | -2.7% | -6.5% | -9.1 | -32 |
| 18 Nov | 7.58 / 15.0 | 2.97 / 4.7 | 0.0% | -2.4% | -3.3 | -27 |
| 25 Nov | 5.9 / 14.2 | 2.48 / 3.6 | -3.8% | -7.8% | -10.8 | -25 |
| 2 Dec | 6.99 / 10.3 | 2.07 / 2.5 | -3.6% | -6.7% | -9.5 | -24 |
| 9 Dec | 9.57 / 14.7 | 2.84 / 3.8 | -5.9% | -9.3% | -14.2 | -38 |
| 16 Dec | 7.9 / 13.3 | 2.37 / 3.7 | -2.1% | -6.0% | -8.6 | -34 |
| 23 Dec | 8.56 / 15.9 | 2.15 / 3.9 | -2.4% | -5.0% | -7.0 | -37 |
Method and honesty
- The baseline is a two-waypoint rhumb line at the instructed speed, weather-evaluated on the same field, and is not an actual sailed voyage.
- Reanalysis replay on ERA5 winds and waves plus GLORYS currents, with perfect foresight of the weather that occurred. The figures are a hindsight ceiling.
- The route is found by the isochrone optimiser in Best ETA; Best ETA + JITA re-paces that same route to the arrival deadline rather than re-routing it.
- The vessel is a generic feeder with weather-response coefficients at unity, uncalibrated against a real ship.
- Configuration: WindMar v0.2.3, isochrone variant, 6 m significant-wave routing cap. ERA5 winds and waves, GLORYS currents, 2024 vintage.
Half the gain is geometry, the rest is weather, and the whole of it is measured at the arrival against an honest baseline.
Decision-support only; not for navigation.