
WindMar v0.2.0: Weather routing on a North Atlantic crossing
Reference MR Tanker · Gibraltar to New York · June 2026
SL Mar, Quantitative Research and Maritime Analytics
Summary
This note quantifies the fuel value of weather routing on a North Atlantic transatlantic passage (Gibraltar→New York, ~3,150 nm) for a Medium-Range product tanker, and applies the same model to a worked seasonal expectation for a late-June departure. Two results are reported. First, across a factorial of season, speed, draught and safety ceiling, the first-order weather-routing fuel gain over a weather-blind route is 2.1% of voyage fuel (physics ceiling, hindcast), rising to above 3% at slow speed, in ballast, and in the active autumn storm track. Second, a worked expectation for a laden 13-knot late-June departure gives a passage consumption of ~199 t over ~10.1 days, in benign summer conditions where a near-great-circle track is close to optimal. All figures are computed on coupled wind, sea-state and surface-current fields. The current field is shown to be decisive: on the same 160 cases, it roughly doubles the mean gain (0.90 → 2.08%) and turns the optimised route from marginally worse than the great circle to marginally better.
1. Method and data
The vessel is a calibrated Medium-Range product tanker performance model (propulsion resistance plus added-resistance in wind and waves, with a measured specific fuel consumption), driven over the route by a least-fuel path optimiser on a 0.5° grid.
Weather is a coupled reanalysis: ERA5 atmospheric fields (10 m wind, significant wave height, mean wave period) at 0.25° native resolution, coupled with CMEMS GLORYS12 surface currents (zonal and meridional components) over the same period. This coupling is treated as a hard requirement, not a refinement: a routing calculation that omits any of wind, sea state or currents is not used, because on this passage the Gulf Stream is precisely the lever that makes routing valuable. The quantitative effect is shown in §2.
The first-order fuel gain is defined as the saving of a route optimised on the realised weather over a weather-blind route optimised on a calm sea on the same grid, both then sailed through the realised weather:
gain = [ fuel(calm-optimised route ⟂ realised weather) − fuel(weather-optimised route ⟂ realised weather) ] / fuel(calm-optimised route)
Using a calm-optimised route on the identical grid as the baseline cancels the grid-discretisation length penalty, isolating the weather-reactive value. The figure is a perfect-forecast (hindcast) upper bound on the tactical value; the operational figure, degraded by forecast error, is bounded above by it.
The factorial spans 20 historical departures (2018 to 2023, all seasons) × 2 calm speeds (11, 15 kn) × 2 draughts (laden, ballast) × 2 safety ceilings (off; on = 6 m wave / 50 kn wind hard walls), 160 cells.
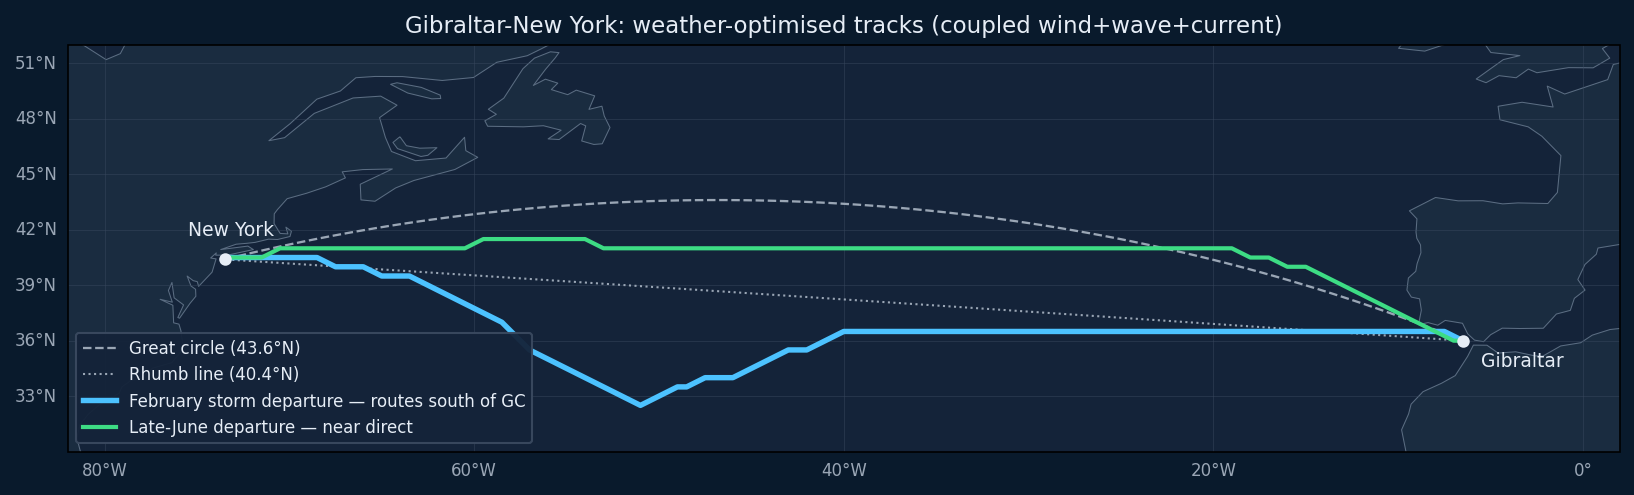
Figure 1, route geometry. Thin grey lines are the great-circle (43.6°N) and rhumb (40.4°N) references. A February storm departure (cyan, coupled fields) routes well south of the great circle to skirt the system, the classic winter move; a late-June departure (green, coupled fields) lies close to the direct track. The 0.5° routing grid is visible as the staircase. The seasonal contrast drives the results in §2 and §3.
2. Weather-routing fuel gain
Across the 160-cell factorial the mean first-order gain is 2.08% of voyage fuel (95% range across cells [−0.6, +7.8]). The value is feast-or-famine: concentrated in the stormy departures and near zero in calm ones. The main effects (Table 1) are physically coherent.
Table 1, weather-routing fuel gain vs weather-blind routing (% of voyage fuel), by factor. Coupled wind+waves+currents, hindcast upper bound.
| Factor | Level | n | Gain (%) |
|---|---|---|---|
| Speed | 11 kn (slow) | 80 | 3.14 |
| 15 kn (fast) | 80 | 1.03 | |
| Draught | ballast | 80 | 2.79 |
| laden | 80 | 1.38 | |
| Season | autumn (SON) | 32 | 3.26 |
| winter (DJF) | 48 | 2.35 | |
| spring (MAM) | 32 | 2.13 | |
| summer (JJA) | 48 | 1.00 | |
| Ceiling | off | 80 | 2.37 |
| on (6 m / 50 kn) | 80 | 1.80 | |
| Overall | 160 | 2.08 |
The gain rises at slow speed (a longer voyage gives more weather exposure and more room to deviate), in ballast (the lighter ship is more weather-sensitive), and is largest in autumn when the storm track is most active. The safety ceiling costs about half a percent of the gain, the price of holding the optimiser away from the fuel-optimal but rougher path. Geographically, the optimised route beats the great circle by 0.3% and the rhumb line by 2.4% on average.
The role of currents is decisive. Re-running the identical 160-cell factorial, same departures, speeds, draughts and ceilings, on atmospheric fields only (wind and waves, no currents) returns a mean gain of just 0.90% and an optimised route that loses to the great circle (−0.82%). Adding the GLORYS surface field on those same cases roughly doubles the gain (0.90 → 2.08%) and turns the great-circle comparison positive (−0.82 → +0.33%). The mechanism is the North Atlantic Current / Gulf Stream, which a westbound ship must work against: in the reanalysis the eastward set reaches ~1.4 m/s near 40°N 50°W, so the least-fuel route trades a little extra distance to skirt the adverse core rather than plough straight through it on the geodesic. An atmospheric-only evaluation therefore materially understates the value of routing on this passage and is not a sound basis for an ROI claim.
3. Worked seasonal expectation: late-June departure
The same model characterises the conditions a laden crossing at 13 kn calm-sea speed should expect in late June. A departure planned in advance falls well beyond the deterministic forecast horizon, so the relevant estimate is climatological: the route is sailed through each of six historical late-June realisations (2018 to 2023) and aggregated. Late June is a benign, low-variance season, so the expectation is tight (Table 2).
Table 2, six historical late-June crossings, laden 13 kn, coupled fields, safety ceiling on.
| Year | Fuel (t) | Days | Mean Hs | Max Hs | Mean wind | Hrs Hs>3 m |
|---|---|---|---|---|---|---|
| 2018 | 199.6 | 10.0 | 1.9 m | 5.1 m | 14 kt | 23 |
| 2019 | 196.9 | 10.1 | 1.4 m | 2.8 m | 11 kt | 0 |
| 2020 | 201.3 | 10.2 | 1.7 m | 2.5 m | 13 kt | 0 |
| 2021 | 199.6 | 10.1 | 1.6 m | 4.2 m | 13 kt | 21 |
| 2022 | 199.9 | 10.1 | 1.7 m | 3.8 m | 12 kt | 25 |
| 2023 | 199.3 | 10.2 | 1.4 m | 2.1 m | 13 kt | 0 |
| Expectation | ~199 | ~10.1 | ~1.6 m | 2 to 5 m | ~12 to 13 kt | low |
The expectation is a passage consumption of ~199 t (band 197 to 201) at ~19.7 t/day over ~10 days 3 h (~3,160 nm), propulsion only; auxiliary load, boiler and manoeuvring are additional. Conditions are mild: mean sea ~1.6 m, mean wind Force 4, the ship essentially holding 13 kn (speed loss under 1%, weather drag and favourable current roughly cancelling). The realistic worst case across six years is a single short ~4 to 5 m / ~29 kt patch (2018), with three of six years never exceeding a 3 m sea.
Consistent with §2, weather routing adds little this month (~0.8% vs a weather-blind track): in a calm summer the great circle is already near-optimal, and the 2% gain is a winter/autumn quantity. The dominant late-June planning risks are not wind and sea but (i) advection fog on the western approaches, where the Gulf Stream meets cold Labrador water, and (ii) the early Atlantic hurricane season, neither captured by the wind/wave climatology and both to be tracked against live products near any departure.
4. Conclusions
- On a North Atlantic crossing the first-order weather-routing fuel gain for this MR tanker is ~2% of voyage fuel (physics ceiling), strongly season-, speed- and draught-dependent: above 3% slow / in ballast / in autumn, near 1% fast / laden / in summer.
- Surface currents are not optional. On the same 160 cases, omitting the North Atlantic Current halves the measured gain (0.90 vs 2.08%) and inverts the great-circle comparison (−0.82 vs +0.33%). A sound routing ROI on this passage must be computed on coupled wind + sea-state + current fields.
- A late-June laden 13-kn crossing is expected to consume ~199 t over ~10 days in benign conditions, where a near-great-circle track is close to optimal and fog and tropical activity, not sea state, are the planning risks.
A companion analysis of beyond-horizon scenario selection (analogue vs climatological forcing past the forecast horizon, evaluated by routing regret) is being re-grounded on the coupled field and will follow.
19762e9, 2026-06-13), driven over ERA5 reanalysis (0.25°, 6-hourly 10 m wind and wave fields) coupled with CMEMS GLORYS12 daily surface currents, 2018 to 2023. Each of the 160 factorial cells and 6 voyage cases is emitted as one row of a results table; every headline figure is an unweighted mean over those rows and is reproducible from them. The grounded gain (2.08%) and the atmospheric-only baseline (0.90%) are computed on the identical 20 departures, the current field being the only difference between the two runs. The surface-current field's sign and magnitude were checked against the source reanalysis (North Atlantic Current ≈ 1.4 m/s eastward near 40°N 50°W). All fuel figures are perfect-forecast (hindcast) upper bounds; the operational figure, degraded by forecast error, is bounded above by them.