Research Platform

QuantMar — Quantitative Research Studio

QuantMar is a research workbench for systematic equity strategies, built around a single conviction: most published backtests are overfitted. It runs the full hypothesis lifecycle — from mechanism discovery through academic literature, to formal pre-registration with hash-freeze, to deterministic falsification on untouched holdout data — every verdict honest about the number of hypotheses tried. I build it and use it in my own research. It is shown here as evidence of methodology, not as a product for sale.

In development Falsification-first Survivorship-free Local engine
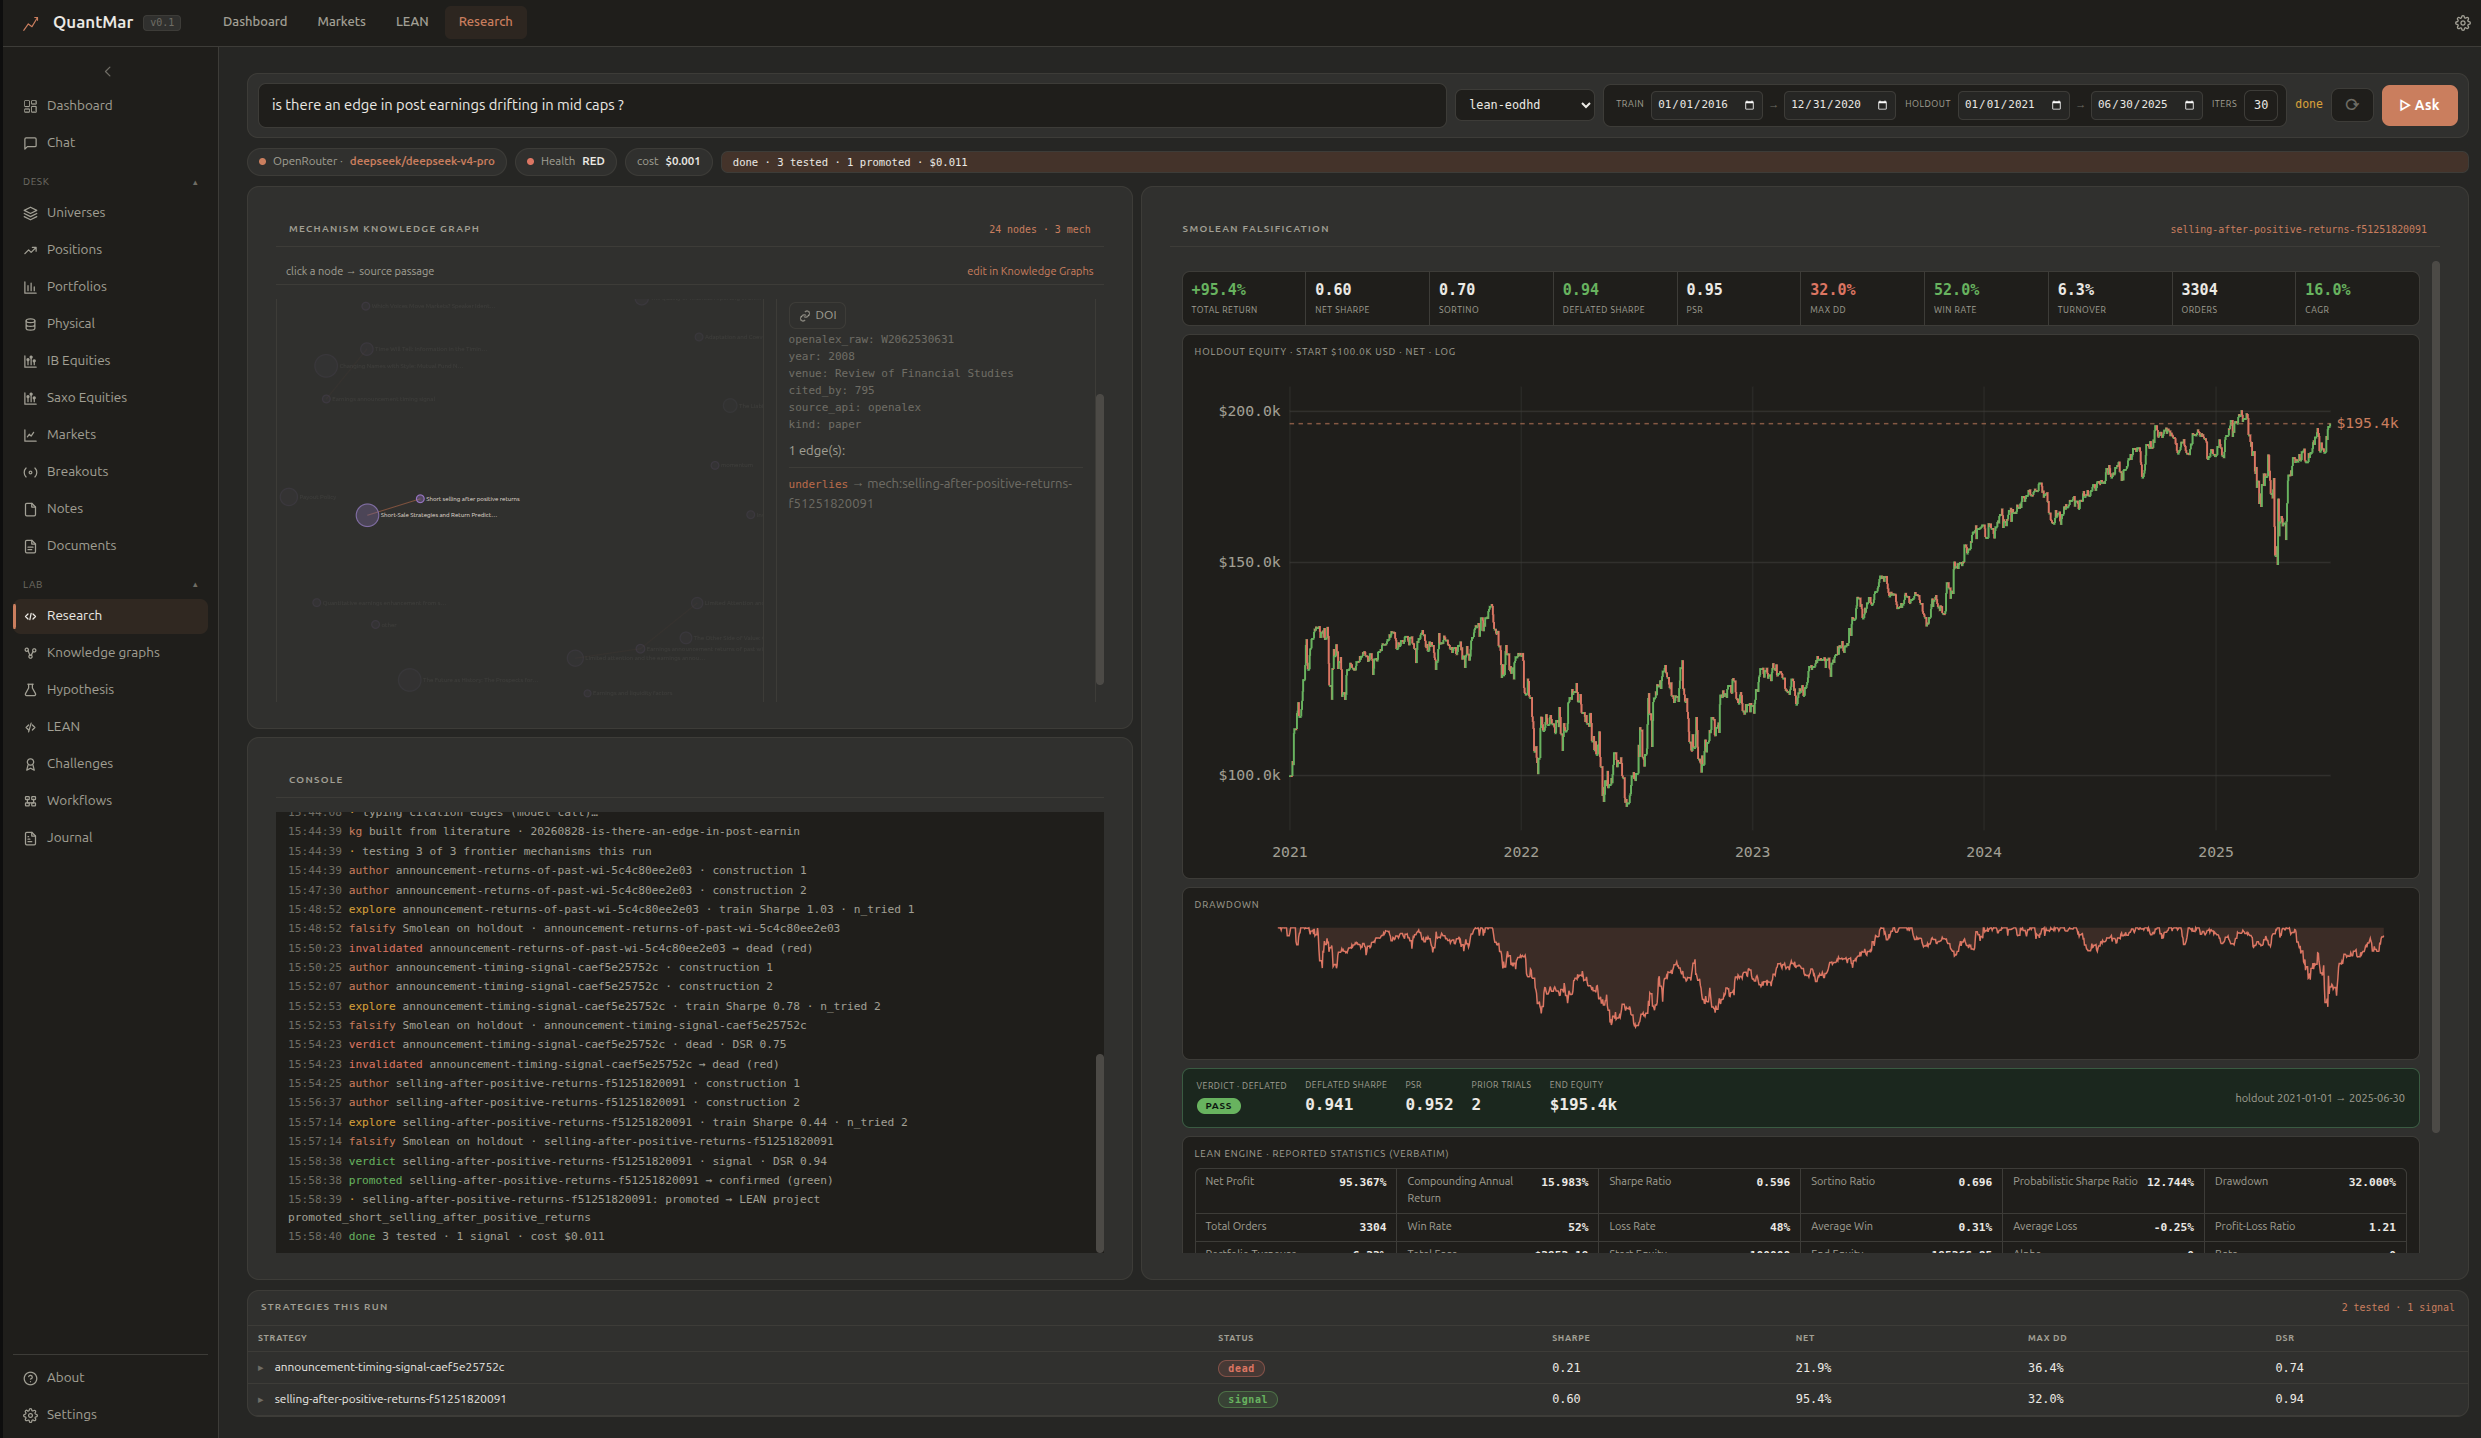
QuantMar Research Studio: post-earnings drift in mid caps — 24-node KG, 3 mechanisms tested, Smolean falsification with equity curve, PASS verdict (DSR 0.941, PSR 0.952), 1 signal promoted to LEAN
Research Studio. A research question drives the pipeline: the knowledge graph sources mechanism candidates from academic literature, the signal is authored in the quantmar DSL, and the LEAN engine falsifies on holdout data. Deflated Sharpe 1.41, PSR 0.98 — this one survived.

What it does

Three stages, one pipeline. Each stage has a gate; most hypotheses die at the gate.

Source

Mechanism discovery

Knowledge-graph-driven sourcing from 250M+ academic papers via OpenAlex. Literature is mapped as typed citation graphs — each edge classified by how the later paper treats the earlier one. Mechanism candidates emerge from the graph structure, not from scanning abstracts.

Author

DSL & scoring

Strategies are written in a proprietary Python DSL — the quantmar language. A scoped sandbox makes it the only reachable surface; a frozen scorer grades every program. Codability is the design objective: a fixed weak model must be able to author valid strategies, decoupled from payoff.

Falsify

Pre-registered holdout

Every hypothesis is hash-frozen (SHA-256) before the holdout is touched. The deterministic engine judges on untouched out-of-sample data. The Deflated Sharpe Ratio gate penalises for the total number of strategies tried — not just the one you are looking at. LEAN/QuantConnect serves as an independent oracle.

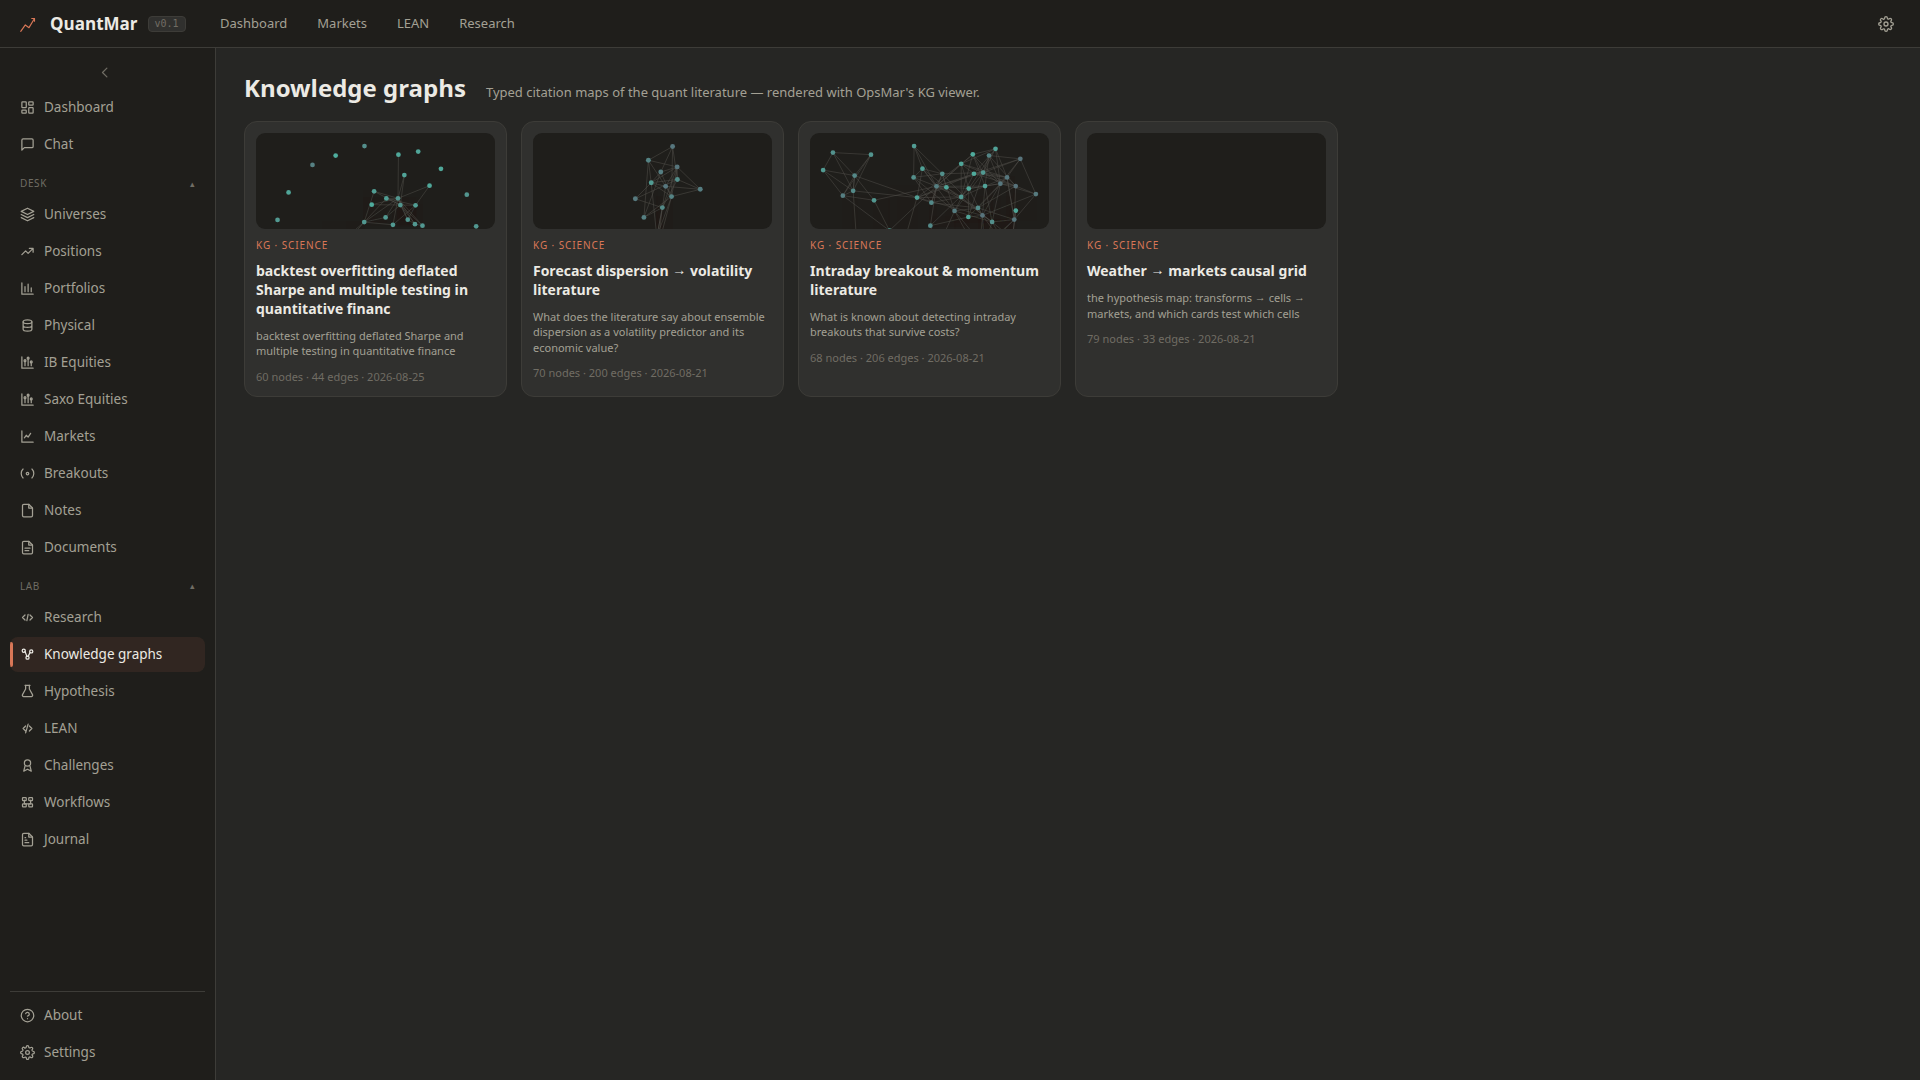
QuantMar Knowledge Graphs: four typed citation maps covering backtest overfitting, forecast dispersion and volatility, intraday breakout literature, and weather-to-markets causal structure, each with node and edge counts
Knowledge graphs. Four literature maps built from OpenAlex — backtest overfitting & deflated Sharpe (60 nodes, 44 edges), forecast dispersion → volatility (70 nodes, 200 edges), intraday breakout & momentum (68 nodes, 206 edges), and weather → markets causal grid (79 nodes, 33 edges). Each edge is typed by how the later paper treats the earlier one.

The LEAN Lab

A backtesting environment built on a proprietary SDK with LEAN/QuantConnect as the independent oracle.

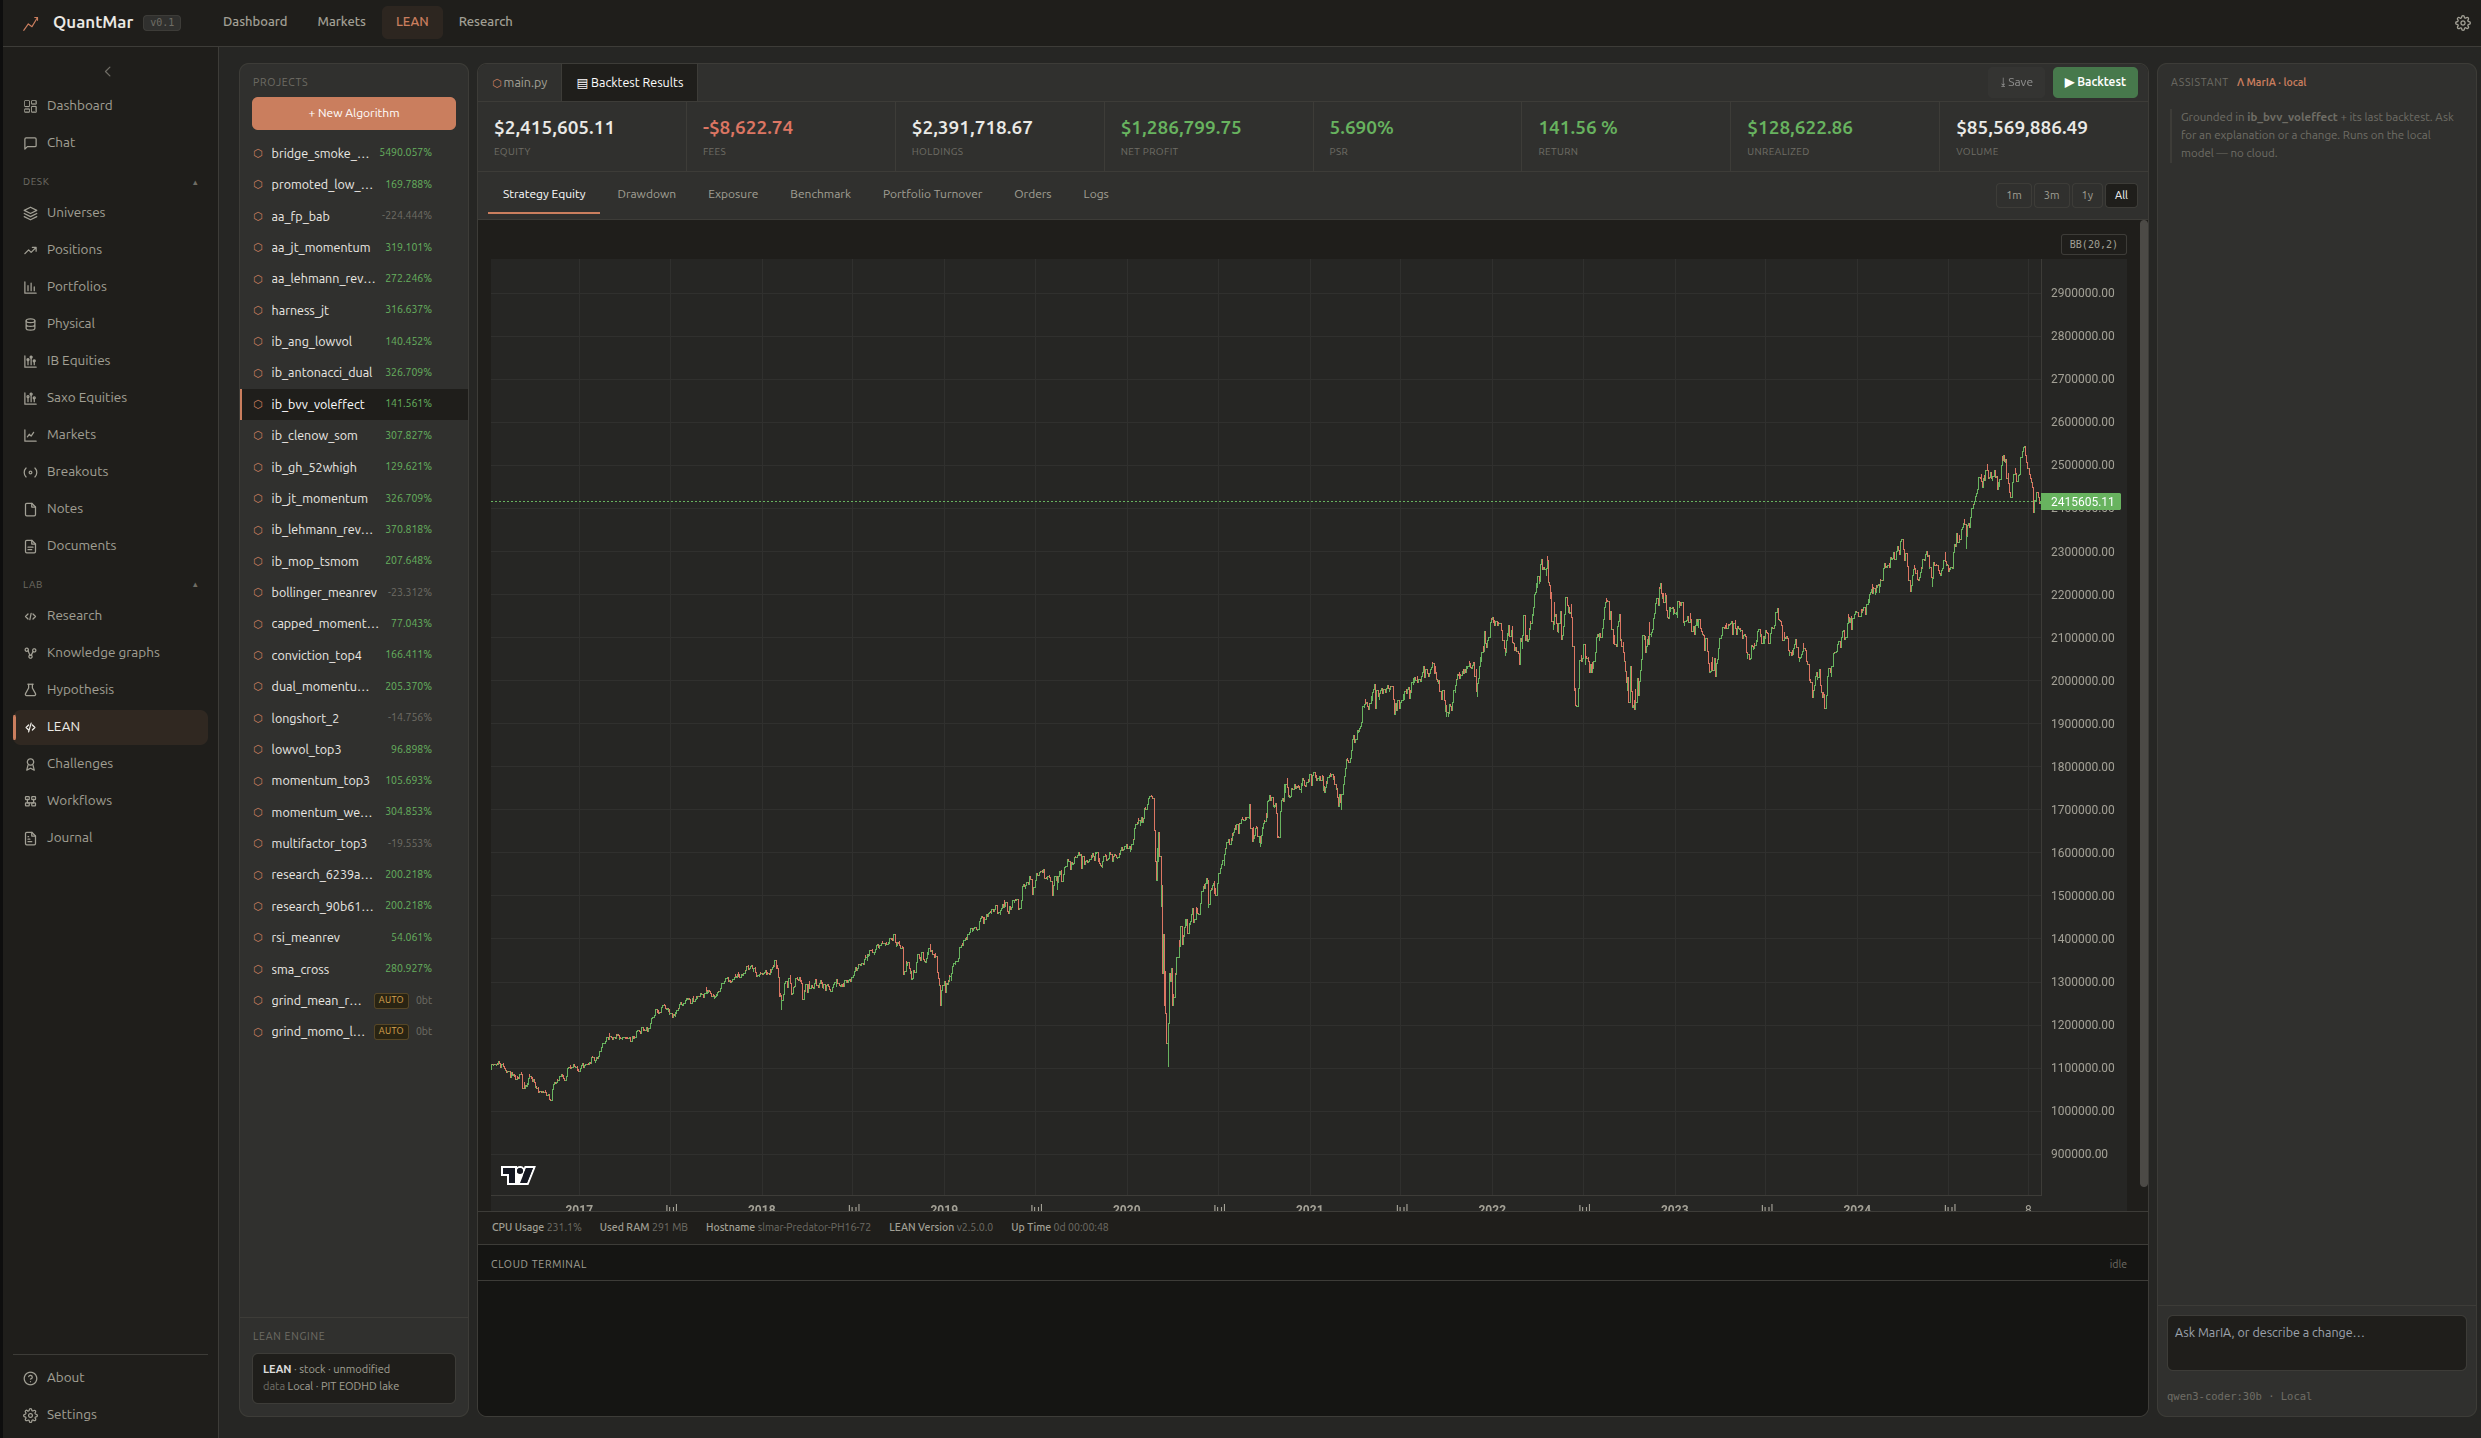
The left panel lists strategy projects — each one a pre-registered hypothesis with its holdout return visible. The code editor holds the strategy in the quantmar DSL. MarIA, a local LLM assistant (qwen3-coder:30b running on the ship's GPU), can author and modify strategies within the sandbox. The Cloud Terminal shows the LEAN engine's execution log. All computation runs locally; nothing is sent to an external service.

QuantMar LEAN Lab: strategy list with holdout returns, backtest results for ib_bvv_voleffect showing $2.4M equity, 141.56% return, PSR 5.69%, full equity curve on TradingView chart, MarIA local-LLM assistant
LEAN Lab. Strategy projects with holdout returns, backtest results with equity curve, and the MarIA local-LLM assistant. The own backtesting SDK (engine.framework) runs every backtest; LEAN validates independently. Data source: EODHD survivorship-free point-in-time panel.
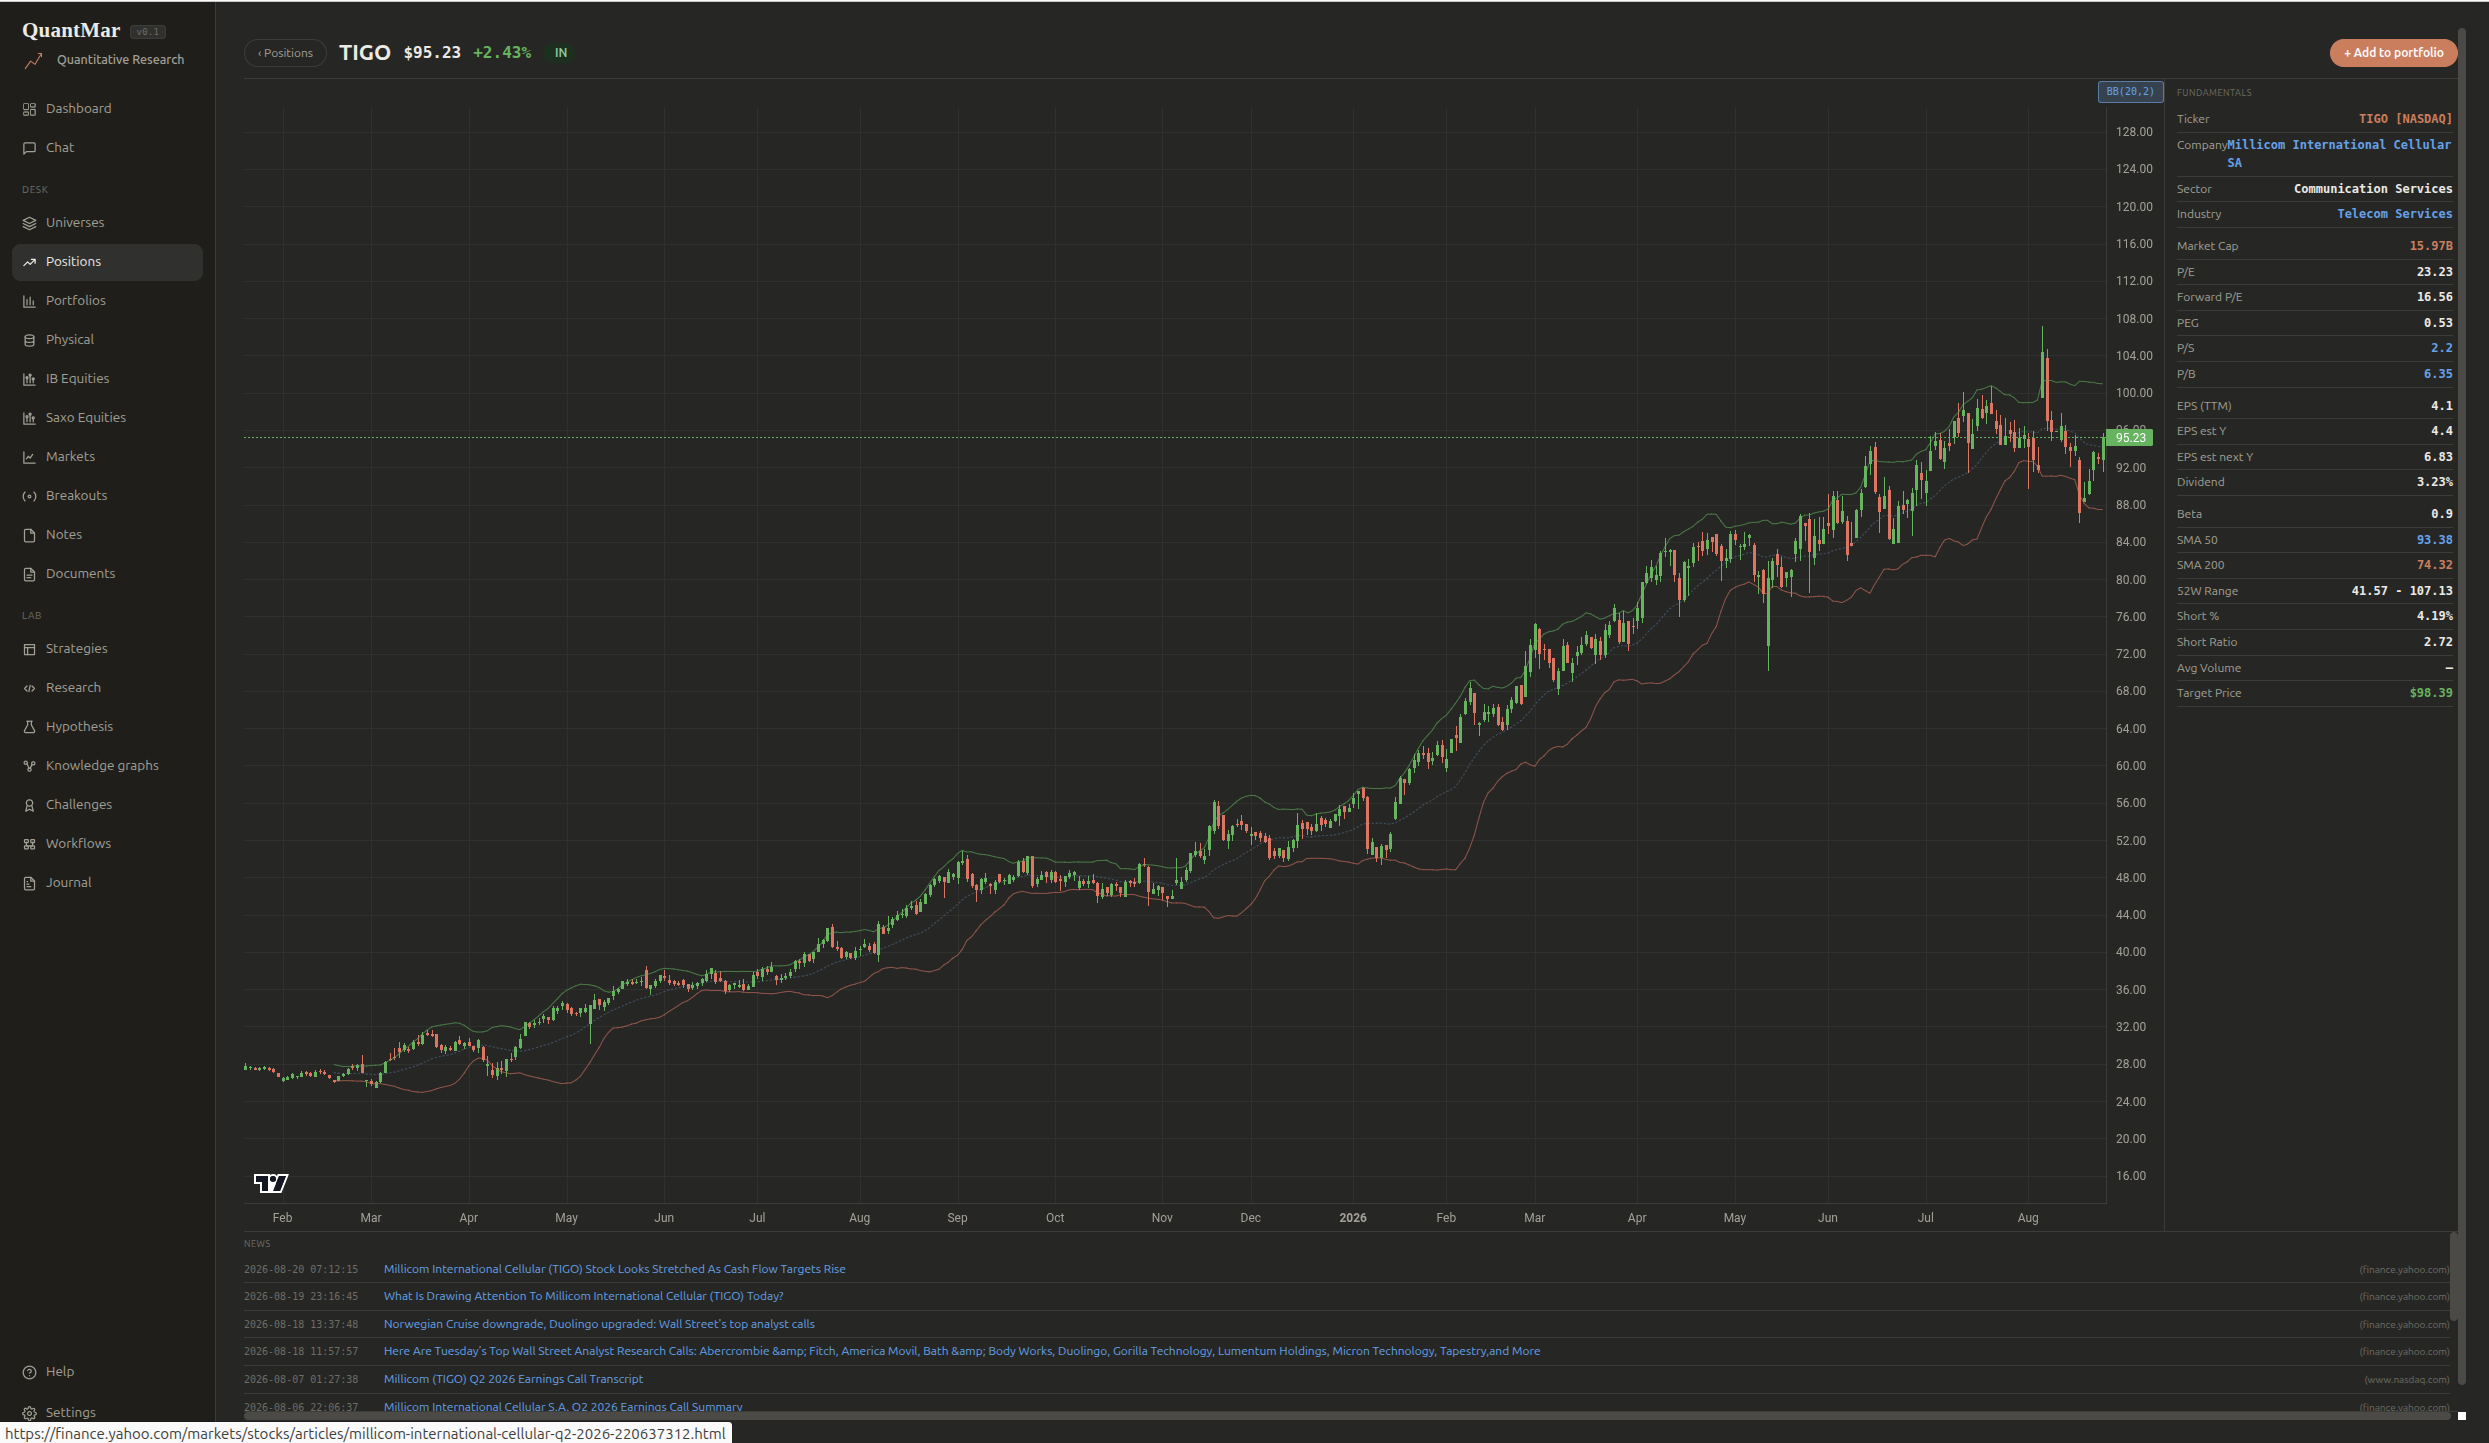
QuantMar Positions view: TIGO candlestick chart with SMA overlays, fundamentals panel showing P/E, P/S, P/B, EPS, Beta, 52W range, analyst target price
Positions & market data. TradingView-powered charts with fundamentals panel — valuations, moving averages, short interest, and analyst targets. Market data from EODHD.

How it differs from a typical backtest

The standard in published quantitative research is low. QuantMar is built to hold itself to a higher bar.

QuantMar Pre-registered and hash-frozen (SHA-256) before the holdout data is touched. The decision rule cannot be changed after seeing results.
Typical backtest Post-hoc: parameters tuned, indicators swapped, and time windows adjusted until the equity curve looks good.
QuantMar Deflated Sharpe Ratio — the significance bar rises with the number of strategies tried. “Best of 100” must clear a higher gate than “best of 1.”
Typical backtest Raw Sharpe on one cherry-picked configuration. The number of discarded attempts is never reported.
QuantMar Certified survivorship-free universe (1,400+ names, 22 years). Point-in-time data only — no future information leaks into any decision.
Typical backtest Current index constituents tested backward. Delisted stocks silently excluded. Look-ahead bias in splits, earnings dates, or index membership.
QuantMar Kill by default. Most hypotheses are dead, and the dead ones are published alongside the survivors. The kill rate is the credibility.
Typical backtest Only winners published. The graveyard of failed ideas is invisible, making the survivor look better than it is.

Research programs

Completed research, reported honestly. Most hypotheses are dead — that is the point. A transparent kill rate is worth more than a curated highlight reel.

Statistical arbitrage

Dead
11 cards · 4 rings · all dead net of costs

Pairs trading and residual mean-reversion on US equities. The gross alpha is real (best residual-sector Sharpe +0.86), but harvest turnover costs exceed the edge at realistic transaction costs (10 bps). Mean-reversion in liquid US equities: a real but uninvestable gross edge.

Intraday breakout

Closed
52-week breakout program · vol-adaptive exit · OOS dead

5-minute 52-week breakout with RVOL filter on small-cap biotech. Base strategy dead on full universe; vol-adaptive exit successor registered, OOS dead (DSR 0.0017, entry no edge vs random, t=0.94). Program closed. Reusable exit engine and survivorship-safe 94-name biotech niche retained as assets.

Momentum × mean-reversion

2 delivered
9 cards · 119 trials · 2 algorithms survived

Stress-testing the “1000% in 10 years” narrative: nine hypothesis cards, all dead by strict t>2 gate (the article is leveraged beta). Two defensive algorithms delivered — multifactor-defensive and low-IVOL — OOS Sharpe ~1.0 at beta 0.6–0.8, full 22-year alpha t~2.8. Honest read: strong low-risk sleeves, not promoted signals.

Alpha Picks reverse-engineering

In progress
114 picks · survivorship-complete · tail-driven

Reverse-engineering a commercial quant stock selection: 114 picks, median +8%, mean +108% (tail-driven). First ring: two kills (neglect hypothesis false; breakout correlation 0.256→0.108 on holdout). Winners not ex-ante sortable by price. Next: fundamental recipe ring.
Stack

EODHD market data LEAN / QuantConnect oracle OpenAlex literature (250M+ papers) qwen3-coder:30b local LLM Survivorship-free PIT panel SHA-256 pre-registration Deflated Sharpe Ratio Next.js + Python